
Figure 5.
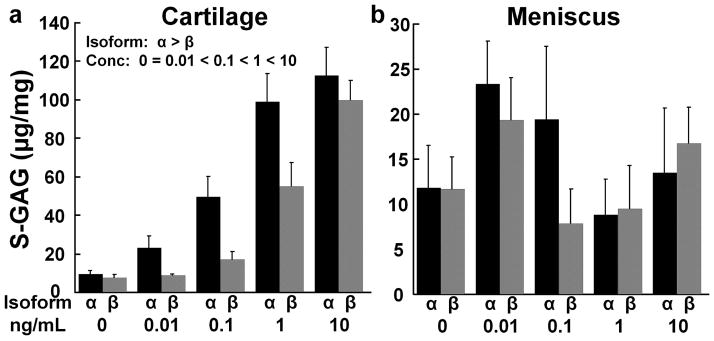
IL-1 effects on sulfated glycosaminoglycan (S-GAG) release. (a) S-GAG release was measured in the media of cartilage explants exposed to various concentrations of IL-1α (black bars) or IL-1β (gray bars). The data is expressed as μg S-GAG/mg wet weight + standard error. There are significant effects of isoform with α > β and concentration with 0 = 0.01 < 0.1 < 1 < 10. (b) S-GAG release was measured in the media of meniscus explants exposed to various concentrations of IL-1α (black bars) or IL-1β (gray bars).