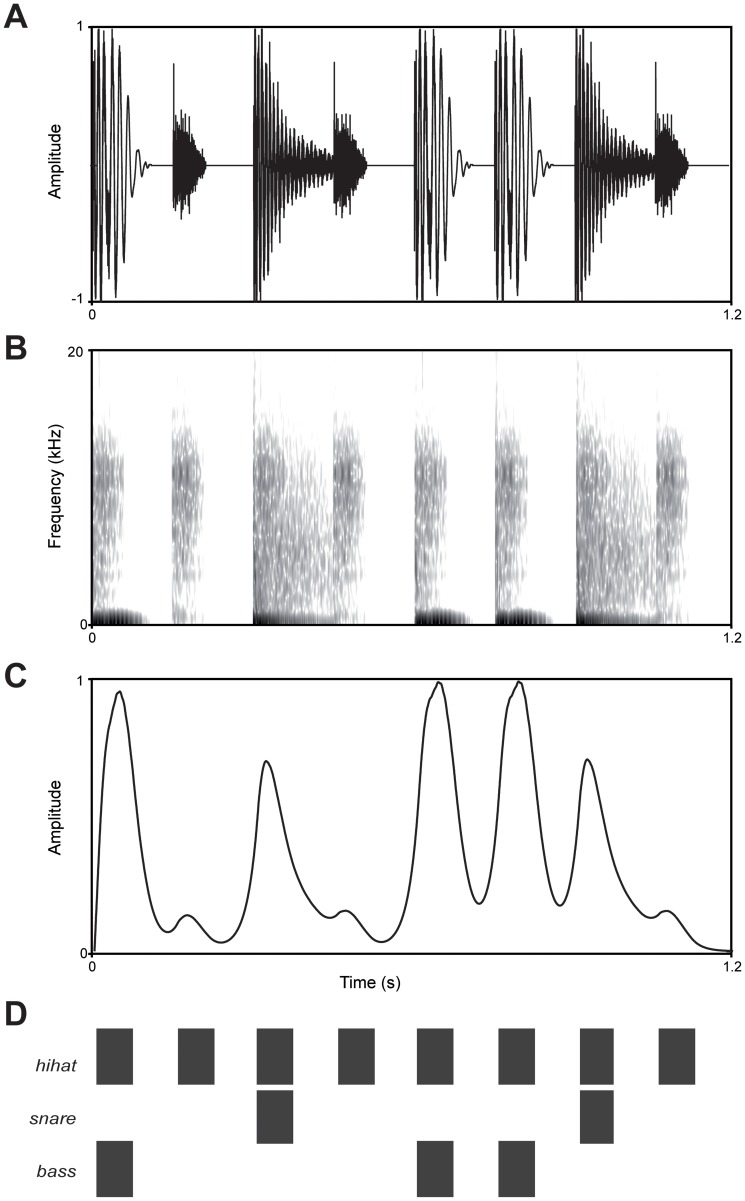
Figure 2. Acoustic analyses of stimulus S1.
A) Waveform, B) spectrogram, C) amplitude envelope, and D) diagram of stimulus S1 (cf. Fig. 1). The spectrogram was calculated with a Short Time Fourier Transform, Gaussian window, window size 2 ms, time resolution 5 ms, frequency resolution 20 Hz, and 50 dB dynamic range. The amplitude envelope was calculated using a loudness model as described in [43].

