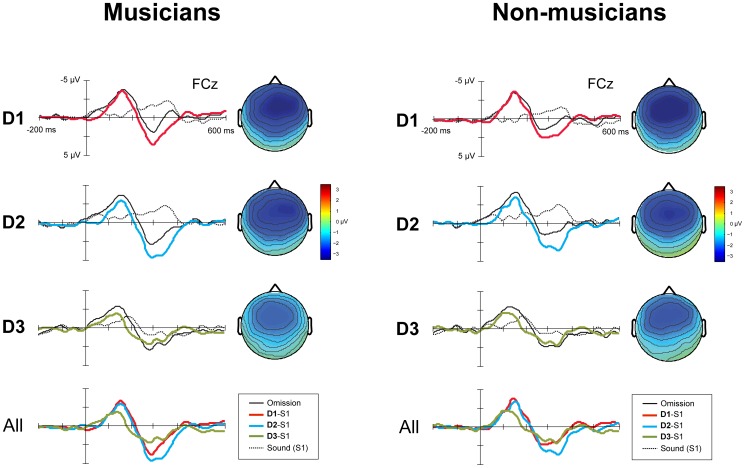
Figure 3. ERP responses for D1, D2 and D3 for musicians (N = 14, left) and non-musicians (N = 15, right).
The panels labeled D1, D2 and D3 show the group averaged ERPs for electrode FCz elicited by omissions, the corresponding position in S1, the derived difference waves and the scalp distributions of the difference waves. The panel labeled All shows all difference waves combined. Time 0 is the onset of the omission, or, in the case of S1, the onset of the corresponding sound. The omissions in D1, D2 and D3 were equally rare in occurrence (0.033) and in all cases, a bass drum sound was omitted.

