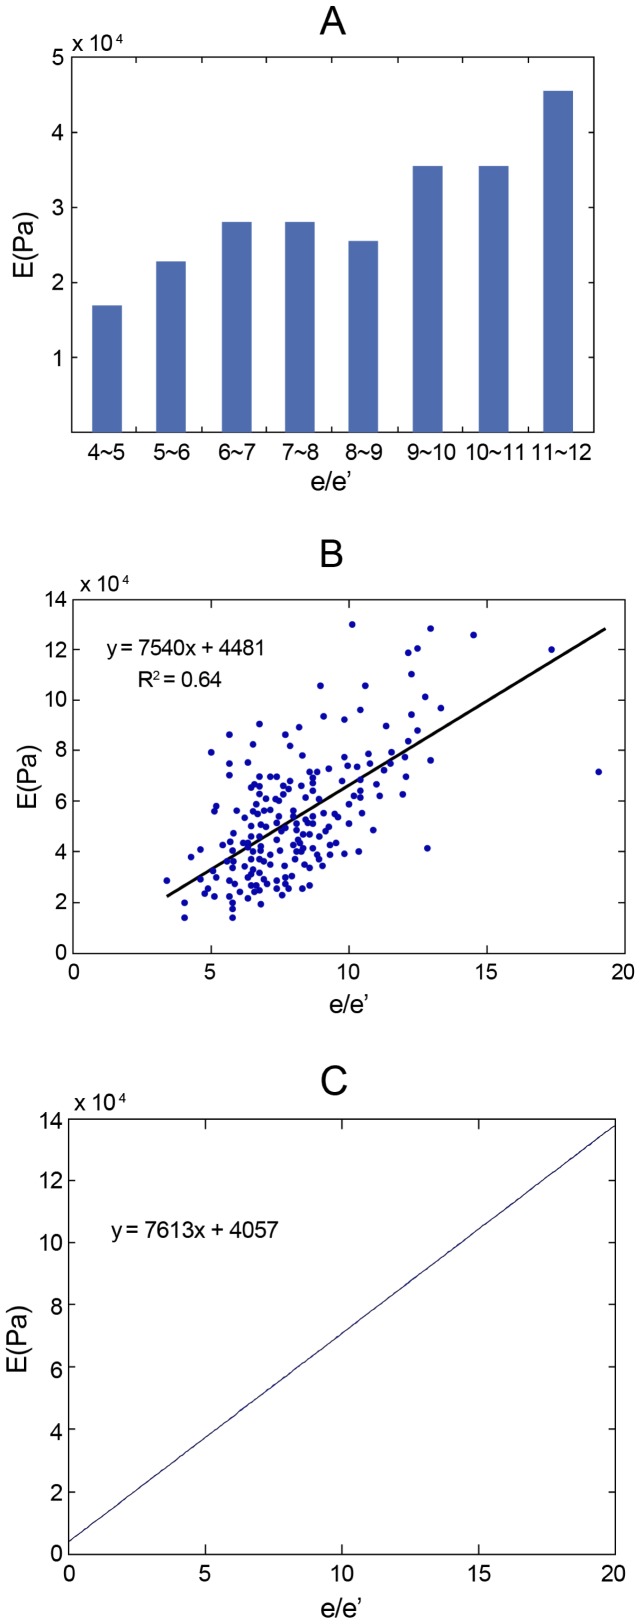
Figure 2. The correlations between  and E both in the clinical statistics and the mathematical models.
A and B: The relationship between  and E in clinical statistics, and C: in the mathematical model.
  = estimated intraventricular pressure by the ratio of early diastolic mitral inflow velocity and the averaged early diastolic velocity of mitral annulus in tissue Doppler imaging;
  .
.

