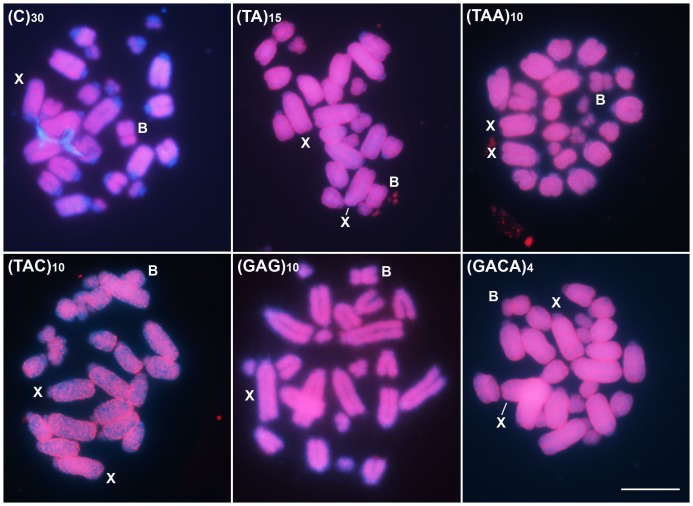
Figure 2. FISH mapping for six microsatellite motifs in embryo mitotic cells of A. flavolineata with scattered distribution.
Each microsatellite is indicated in each image. The B and X chromosomes are pointed in each image and the sex of the embryo can be noticed by the occurrence of one (male X0) or two (female XX) X chromosomes. Note the absence of signals in the heterochromatic areas for (C)30. Bar = 5 µm.

