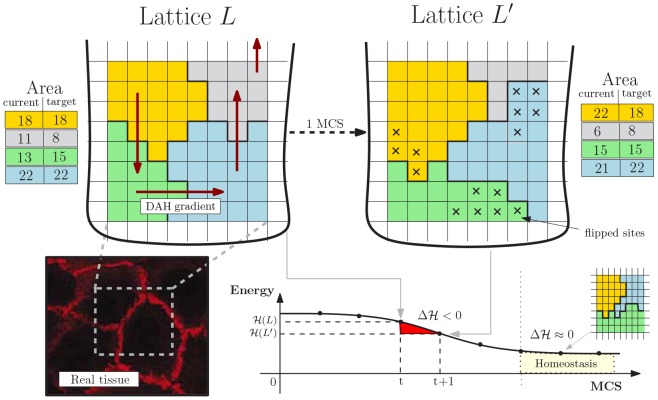
Figure 2. Cellular Potts Model.
Lattice-based representation of the crypt tissue as a opened and rolled out lattice  , with
  cells. The energy gradient induced by the DAH via
  and the current/target area for each cell are represented. An example MCS step is shown resulting in the re-arrangement of
  in favor of
  (
( flips accepted), whose hamiltonian energy is lower. The final tissue stratification is achieved when
  where the grey cell is expelled in the lumen. In the left corner an example picture of real tissue is displayed.

