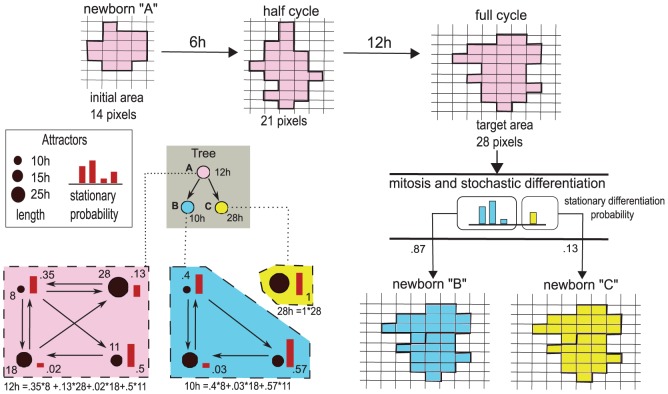
Figure 4. Multiscale link.
Example representation of the multiscale link for three distinct cell types  (pink),
  (blue) and
  (yellow), belonging to the shown lineage tree. A specific Treshold Ergodic Set is associated to each cell type. The length of each attractor composing the TES is given by the size of the different circles, whereas the stationary distribution is represented by the red bars. The length of the cell cycles is then computed with Eq. 5. A cell cycle for a cell of type
  is shown in the upper row: the newborn cell starts with an initial area of
  pixels and doubles its area in
  hours. At the end of its cycle it undergoes mitosis and differentiates stochastically. The stationary probabilities suggest that most likely daughter cells will be of type
  , rather than
  . In the two scenarios the newborn cells will have different cell cycle length and division pace, and will lead to different differentiation fates. This shows how the GRN dynamics affects the tissue-level cell dynamics.

