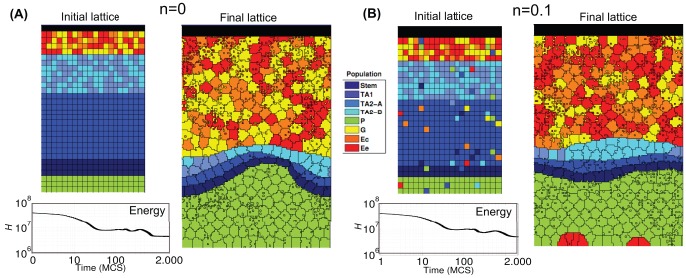
Figure 5. Crypt homeostasis - 1.
Initial lattice configurations for  (A) and
  (B) and corresponding lattice after simulating
  hours of crypt evolution, for a single simulation. The overall system energy is the average of
  independent simulations. Crypt layout was drawn by using the visualization capabilities of CompuCell3D [107].

