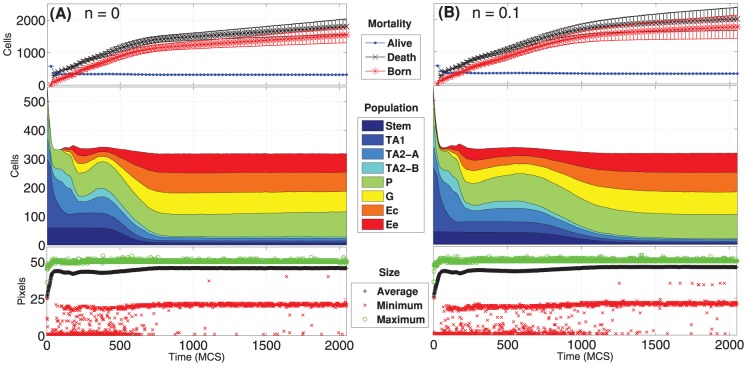
Figure 7. Dynamics of the cellular populations - 1.
Number of cells for each cellular population (cumulative), number of newborn, dead and alive cells and maximum, minimum and average cell size, in time. Notice the prediction of  cells, regardless of the two initial conditions
  (A) and
  (B). The length of the transient is similar, in both cases.

