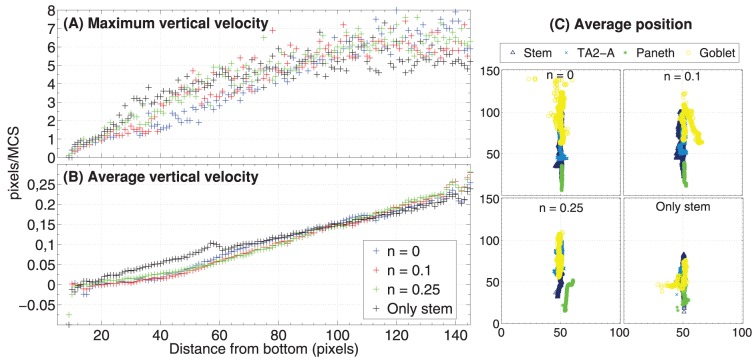
Figure 9. Cell migration.
Relation between the distance from the bottom of the crypt (in pixels, i.e.  ) and the maximum (A) and average (B) vertical velocity of the center of mass of all cells. This is averaged for all simulations, at all the time steps. In (C) we show the average center of mass for stem, Goblet, Paneth, TA2-A, averaged on all simulations and sampled every
  MCS.
MCS.

