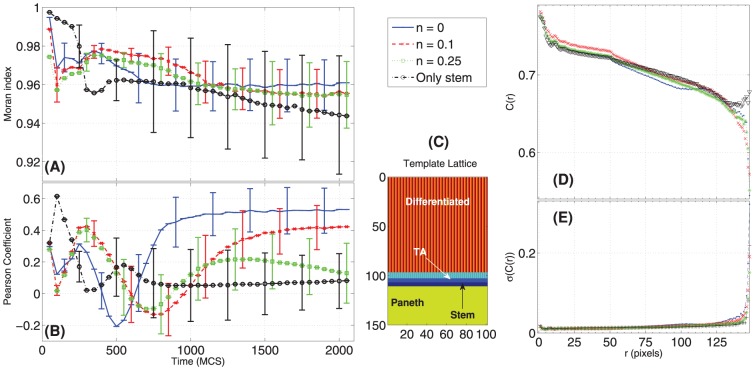
Figure 10. Spatial statistics for crypt stratification and coordinate migration.
Time-variation of the Moran Index, MI (eq. 10) (A) and of the Pearson Coefficient, PC (eq. 11) (B). In (D) the Spatial Correlation  (eq. 8) with the relative standard deviation (E) is displayed, for the four initial conditions. A crypt can be considered well stratified if its MI is high (it is indeed stratified), and its PC is high (it has the cellular populations in the correct order), according to a template (C).

