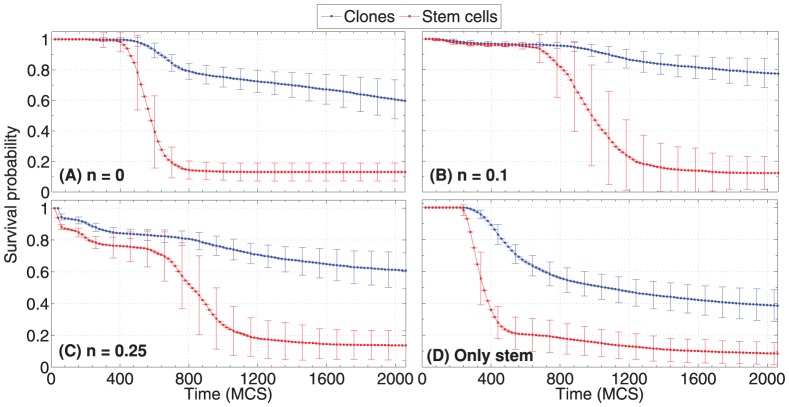
Figure 11. Survival probability of stem cells and clones.
For each of the initial conditions in Figure 5 and 6 and for all the simulations we evaluate the average and the standard deviation of the survival probability of stem cells and clones, as the ratio, over time, of alive stem cells and clones over the initial number of stem cells.

