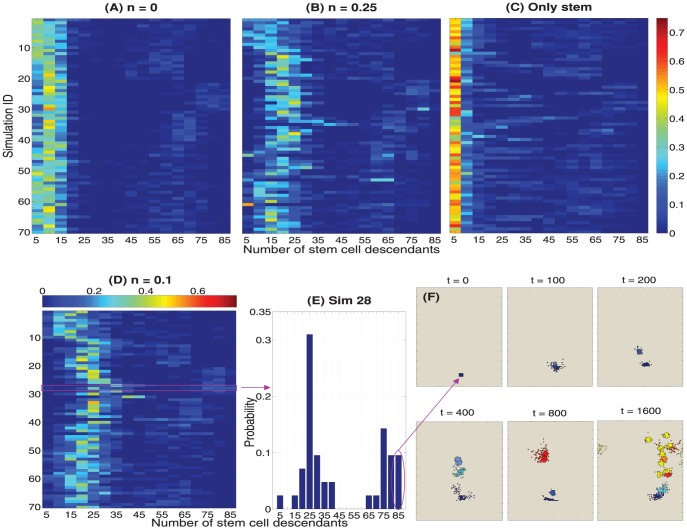
Figure 12. Stem cells descendants.
Empirical discrete probability distributions of the number of stem cell descendants (alive and dead) assessed at the final simulation time:  MCS. These heatmaps consider all the simulations and all the initial conditions: (A)
  , (B)
, (B)  , (C) only stems and (D)
  . (E) is the histogram for the
  simulation with
  . (F) shows the alive progeny of a stem cells with
  descendants at the instants
  , colored according to the cell types.

