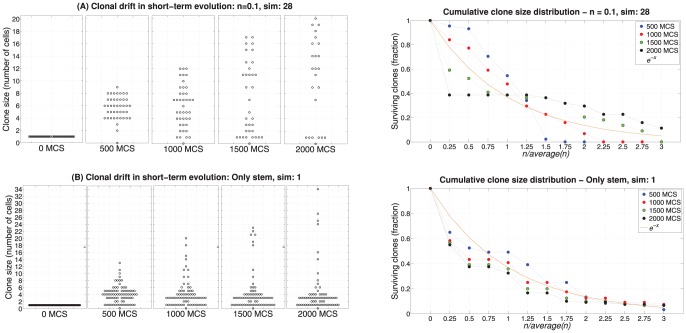
Figure 14. Clonal drift and scaling of the clone size distribution.
On the left panels, we estimate at the instants  the number of cells constituting each alive clone for: sim 28,
  , in Panels A and sim 1, Only stem case, in Panels B. On the right panels, we plot the proportion of alive clones for which the ratio between their size and the average clone size:
  is larger than
  , at the instants
  . Also we show how the distributions scale with respect to
  .
.

