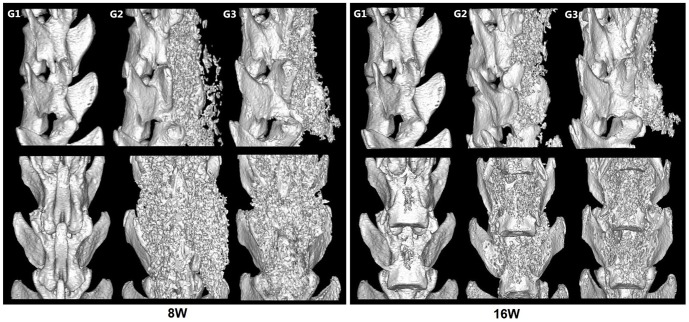
Figure 5. Representative 3D reconstruction images of Micro-CT images.
8W: The images of 8 weeks after the implantation showed that obvious new bone formed in G2 and G3 while a similar phenomenon did not appear in G1. 16W: The images of 16weeks after the implantation showed that the spines of all the rats exhibited considerable new bone formation in G3 and fusion masses were significantly larger and denser than G2. There was still no new bone found in G1.

