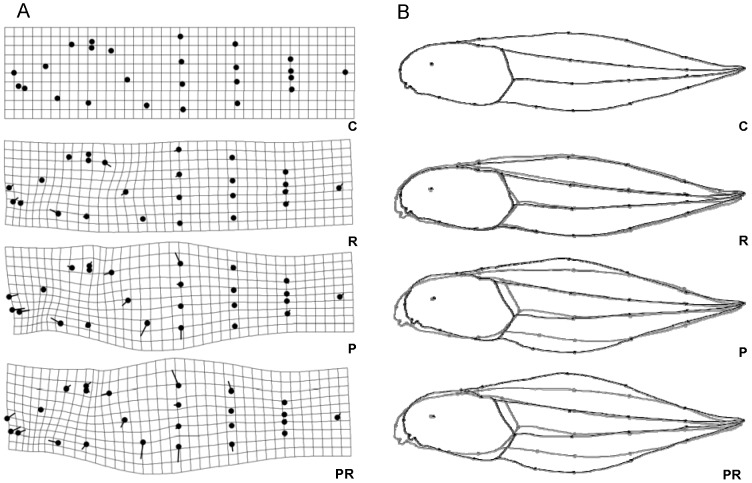
Figure 3. Transformation grids with landmarks and warped outline drawings for each treatment's tadpole shape.
a) Transformation grids with landmarks (black dots) and vectors showing direction of variation; b) comparison of warped outline drawings for each treatment shape (black) and control shape (grey). Transformation grids and warped outline drawings were magnified (x5) to better illustrate the differences. C – Control, R – Roundup, P – Predator and PR – Predator + Roundup.

