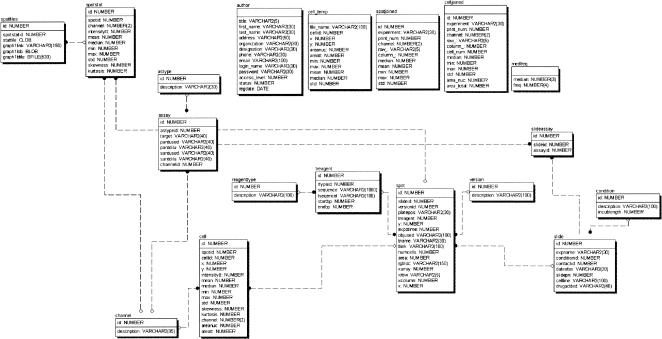
Figure 2.
The entity relationship diagram shows the relational model applied to tracking data on individual experiments. The fields and their relationships for the various levels of information are shown by connecting lines. System users are able to load, retrieve, and update experiment information in the database via a Web interface.

