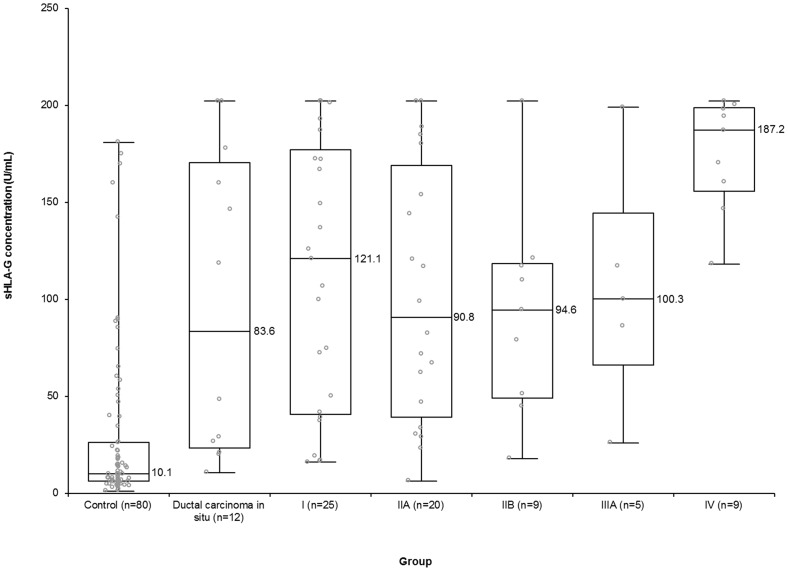
Figure 1. Serum sHLA-G concentrations in the control group and breast cancer group based on TNM stage.
Levels of sHLA were significantly increased in patients with breast cancer compared to healthy individuals (P<0.001). The median sHLA-G concentration of stage IV patients was significantly higher than that of all other groups (P<0.001). The upper and lower ends of boxes and inner lines correspond to the upper and lower quartiles and median values, respectively. The median values of the groups were presented on the right side of the inner lines. Whiskers indicate minimum and maximum values, and circles denote individual values.

