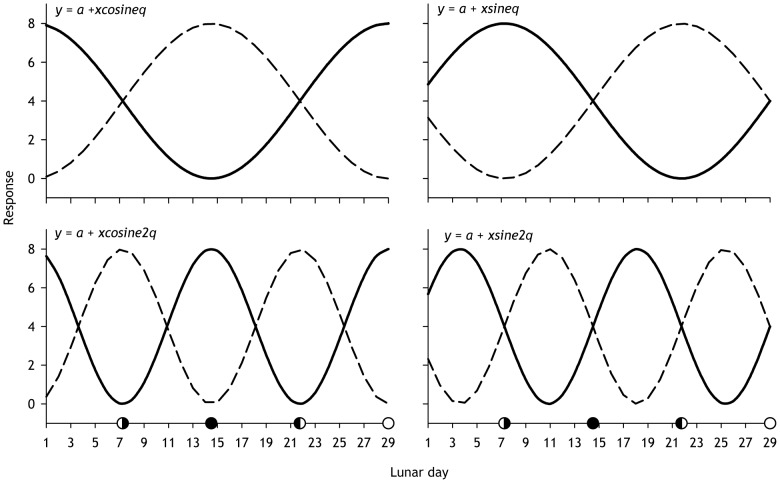
Figure 2. Simulated patterns for single lunar predictor periodic regression models.
For each simulation, a was set at 4. For models with solid lines x was set at 4. For models with dashed lines x set at -4. The lunar cycle starts at 0001 h on the morning after the full moon. Response corresponds to catch, CPUE, or angler effort. In these simulations, the maximum relative effect is 100%.

