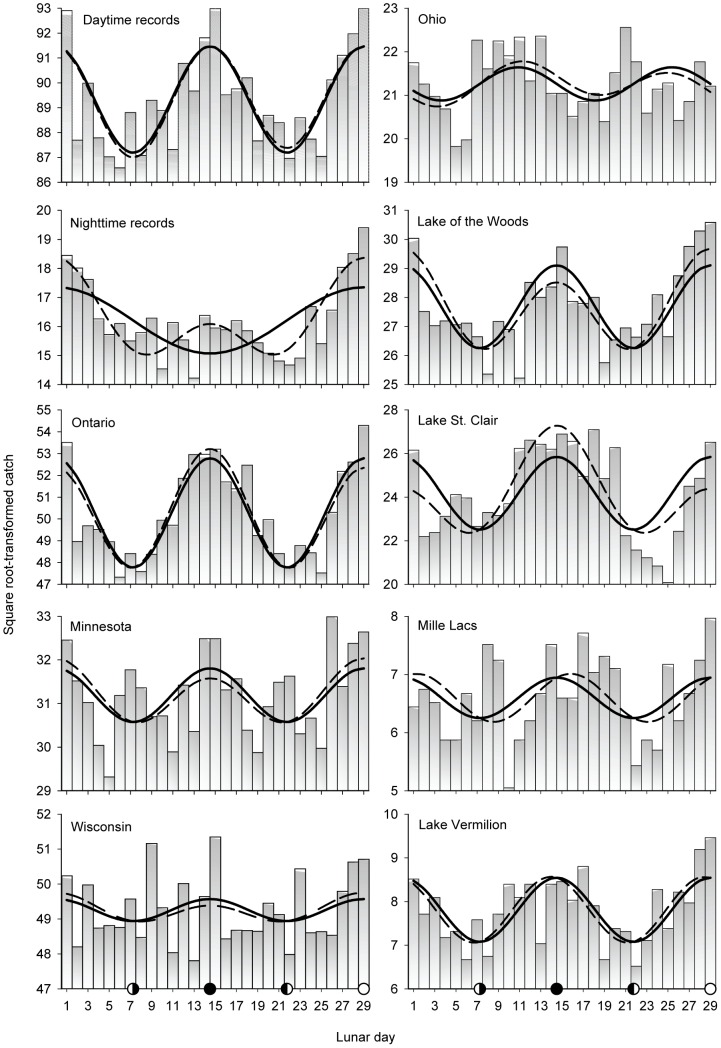
Figure 3. Periodic regression results for catch records.
Bars are transformed counts. Solid regression lines are for the best single-predictor regression model. Dashed lines are for the best two-predictor model. Regression statistics given in Table 1.

