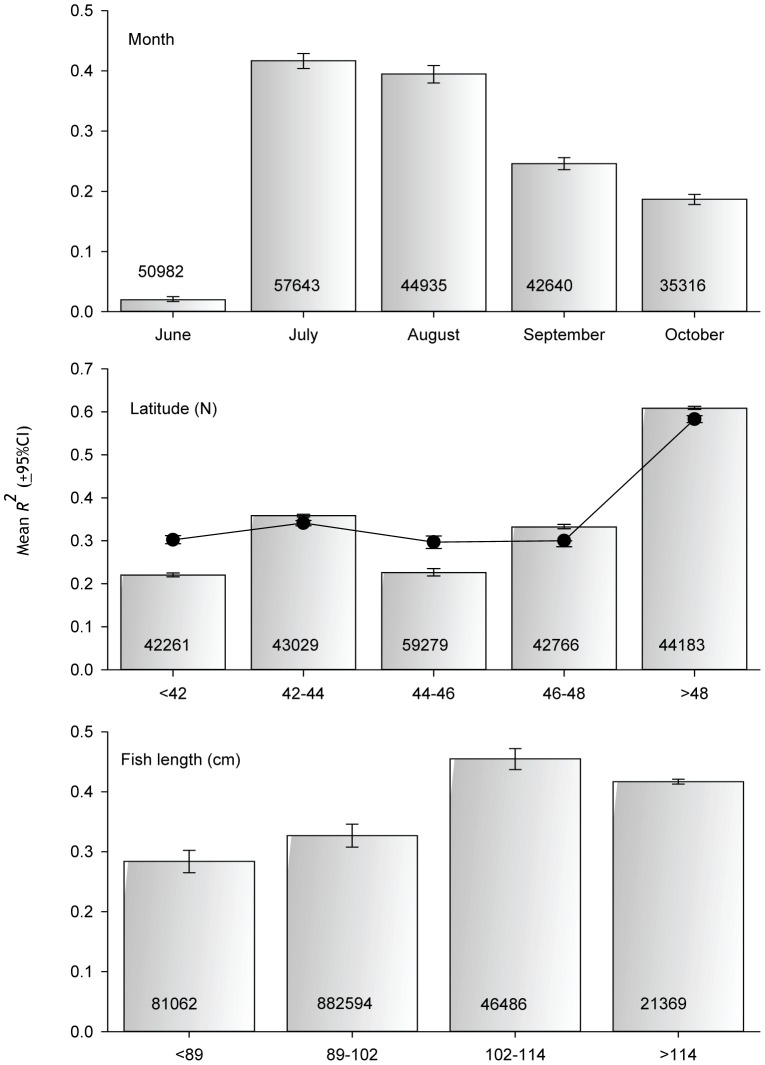
Figure 6. Factors influencing the strength of the relationship between the lunar cycle and number of fish caught.
Mean R2 values are for 100 model runs of 30,000 (latitude and month) or 20,000 (length) randomly selected daytime caught fish. All models are of the form y = a+xcosine2θ, where y = number of fish caught and θ is the angular equivalent of lunar day. Value inside bars is N. Scatter plot for Latitude is the mean R 2 when June and October are excluded from regression models.

