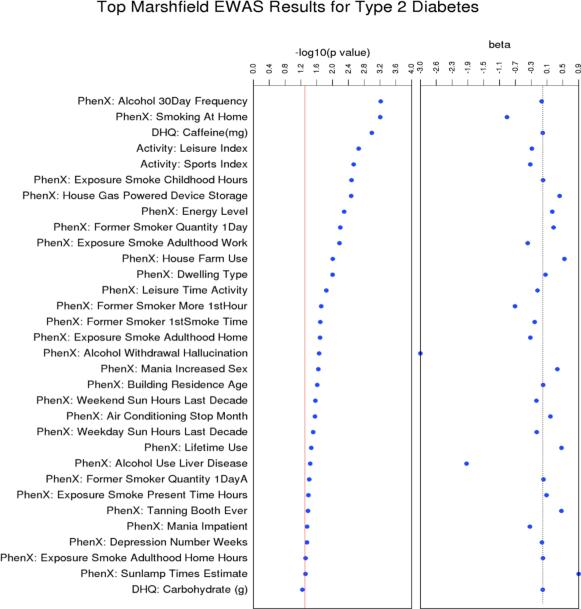
Figure 1. The most significant association results in the Marshfield sample using PhenX Toolkit, DHQ, and Measurement of a Person's Habitual Physical Activity surveys.
The PhenX variables are listed along the Y-Axis. The first track shows the results of our EWAS, with –log(10) of the p-value plotted from most significant result at the top and descending in order. The next track shows the magnitude and direction of the effect. Case/control status was coded as 1=Control, 2=Case.

