Figure 2.

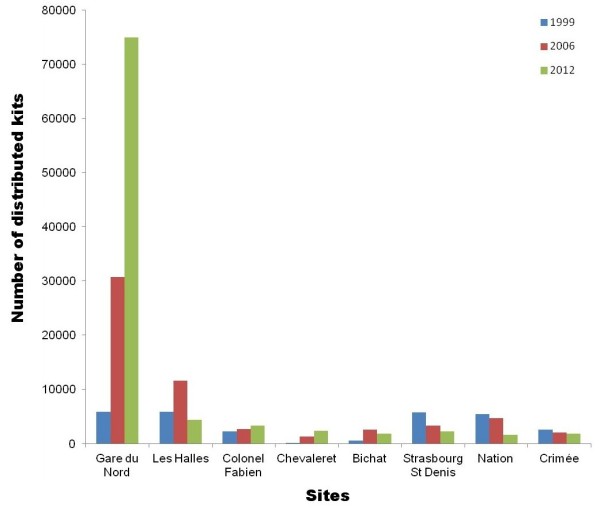
Site-to-site variation over time. Eight sites were followed for their distribution activity over 10 years (blue: 1999, red: 2006 and green: 2012).

Site-to-site variation over time. Eight sites were followed for their distribution activity over 10 years (blue: 1999, red: 2006 and green: 2012).