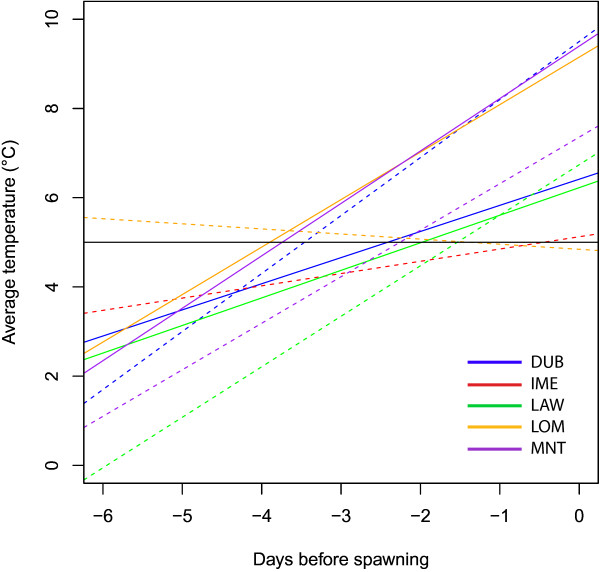
Figure 2.

The average daily temperature for the week prior to egg mass observation (days before spawning) for each site, seen as a linear regression line of the points. Solid lines show high- and dashed lines show low-altitude sites per mountain. The black horizontal line shows the 5°C threshold generally considered to limit activity in R. temporaria.
