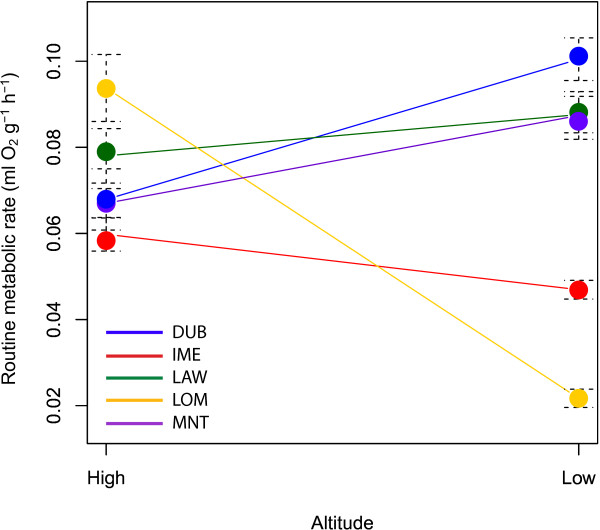
Figure 3.

Routine metabolic rate by mountain and altitude. The mean routine metabolic rate per site is shown by a circle, with the bars representing the standard deviation around the mean. Low- and high- altitude sites within each mountain are linked using a straight line; a positive line shows that RMR is higher at low- vs. high-altitude, whereas a negative line shows that RMR is lower at high- vs. low-altitude.
