Figure 2.

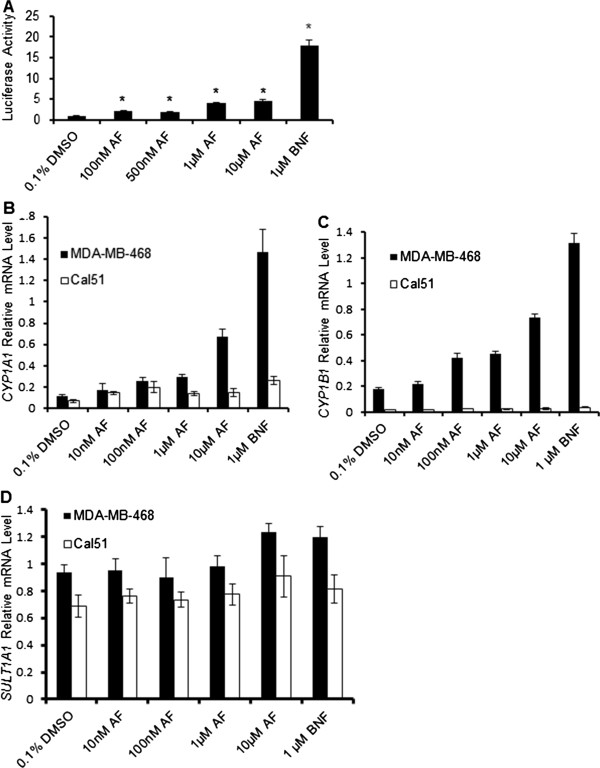
AF increases expression of a DRE-luciferase reporter, CYP1A1, and CYP1B1. (A) Quantitative representation of AF’s ability to induce luciferase expression downstream of DRE sites in the 101 L hepatoma model. Raw luciferase data was normalized to the DMSO control and to total protein in each sample as determined by the Bradford method. Data is presented as mean normalized luciferase activity ± S.E.M. of triplicate samples. * p ≤ 0.05 compared to DMSO control. (B) Quantitative representation of RPL13A-normalized levels of CYP1A1 gene expression in MDA-MB-468 and Cal51 human breast cancer cell lines exposed to a range of AF concentrations and an AhR agonist as a positive control, using SYBR-based quantitative PCR. Data is presented as mean relative mRNA level ± S.D. of triplicate samples. (C) Quantitative representation of RPL13A-normalized levels of CYP1B1 gene expression in MDA-MB-468 and Cal51 human breast cancer cell lines exposed to a range of AF concentrations, using SYBR-based quantitative PCR. Data is presented as mean relative mRNA level ± S.D. of triplicate samples. (D) Quantitative representation of RPL13A-normalized levels of SULT1A1 gene expression in MDA-MB-468 and Cal51 human breast cancer cell lines exposed to a range of AF concentrations, using SYBR-based quantitative PCR. BNF serves as a positive control. Data is presented as mean relative mRNA level ± S.D.
