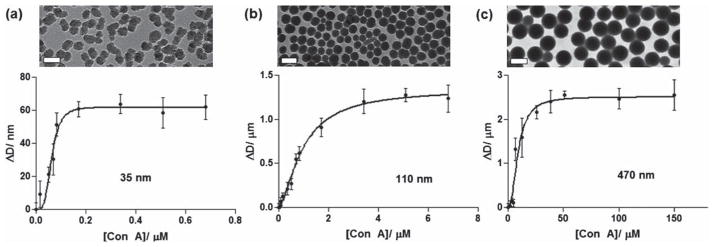
Fig. 3.

The change in the particle diameter (ΔD) vs. lectin concentration: experimental data (circles) and the corresponding Hill fitting curves (lines) for (a) 35 nm, (b) 110 nm, and 470 nm silica particles, respectively. The scale bars in the TEM images are (a) 50 nm, (b) 200 nm, and (c) 500 nm, respectively.
