
Fig. 2.
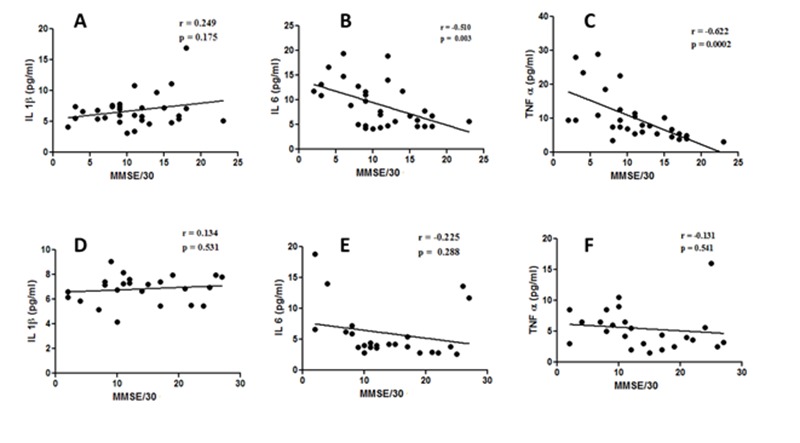
XY scatter plots between MMSE scores and serum levels of IL-1β (A) or IL-6 (B) or TNF-α (C) in AD subjects with depression or serum levels of IL-1β (D) or IL-6 (E) or TNF-α (F) in AD subjects without depression. The degree and nature of correlation between the MMSE score and the serum parameter in AD patients is given by the value of r (correlation coefficient) as explained in the methods. A value of p < 0.05 was considered as statistically significant.