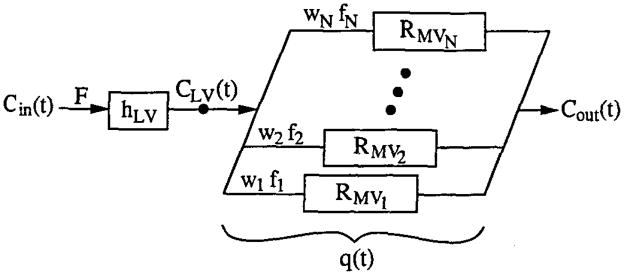
Figure 4.

Model of myocardial intravascular transport. Cin(t) = indicator concentration time course in left ventricular blood pool, F = blood flow in myocardial tissue ROI, hLV = transport function of large vessels upstream from ROI, CLV(t) = concentration time course at microvascular inlet of ROI, f1…fN = flow in first through Nth capillary pathway, w1…wN = fraction of tissue having flow equal to f1…fN, RMV1…RMVN = residue function for the first through Nth pathway, q(t) = quantity of indicator within ROI (detected externally), and Cout(t) = concentration time course in venous outflow of ROI.
