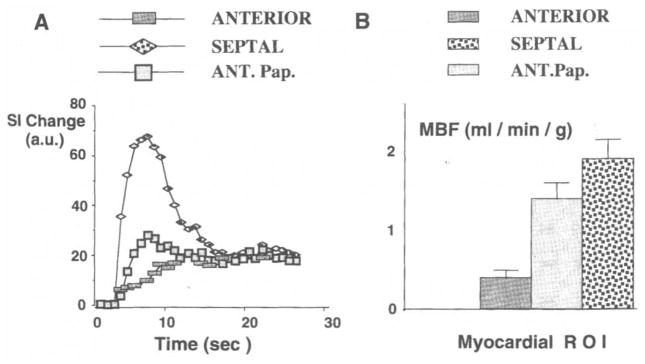
Figure 7.

Baseline- and background-corrected STCs are shown for the heart imaged in Figure 6. The STCs due to transit of the polylysine-Gd-DTPA bolus (A) and the corresponding MBF values determined from microsphere measurements (B) are shown for three ROIs (ANTERIOR = anterior wall, SEPTAL = inferior septal wall, ANT.Pap. = anterior papillary muscle). The error bars in the MBF data represent the standard deviation from the mean for two myocardial samples taken from the epicardial and endocardial regions in each ROI.
