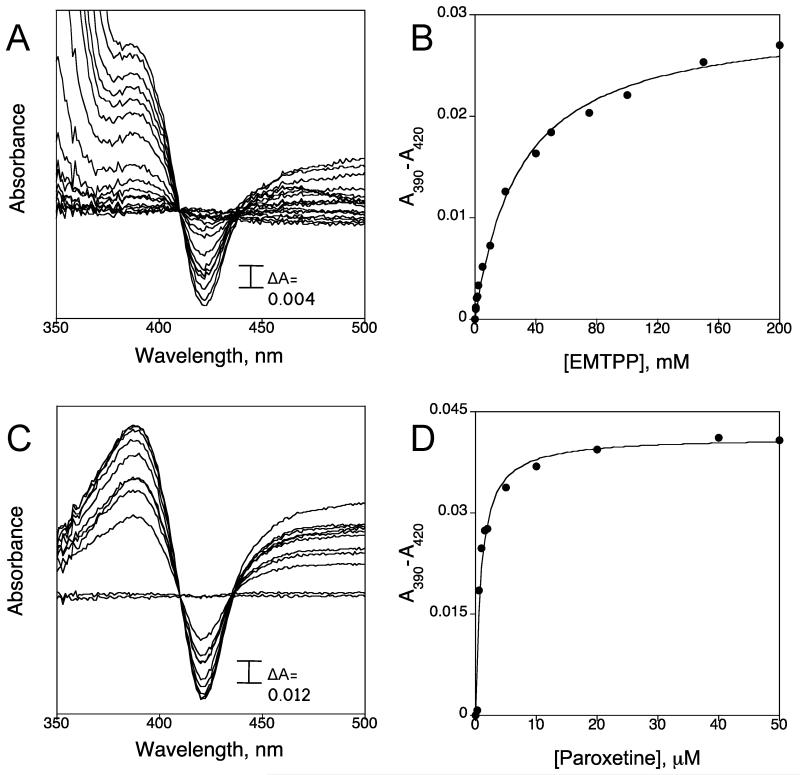
Figure 2.
Spectral binding titration of CYP2D6 and determination of spectral binding parameter Ks. (A) Titration of CYP2D6 with EMTPP and (B) plot of ΔA430-395 (from panel A) vs. concentration of EMTPP. (C) Titration of CYP2D6 with paroxetine and (D) plot of ΔA430-395 (from panel C) vs. concentration of paroxetine.

