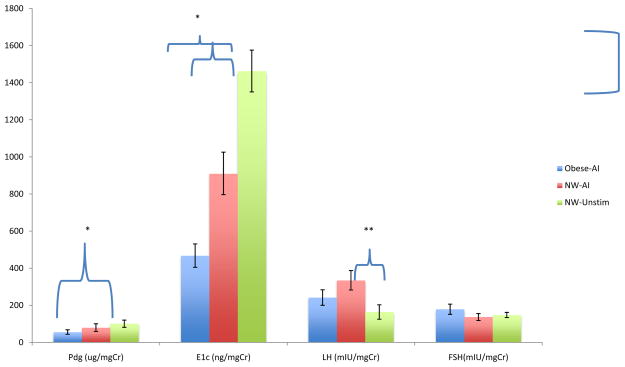
FIGURE 2.
Transverse summed hormone concentrations +/− SEM throughout the menstrual cycle in obese, AI treated women (n=12; blue); normal weight, AI treated women (n=10; red) and normal weight unstimulated historical controls (n=14;green) demonstrating the large differences in E1c by group. Post-hoc differences between two groups are indicated by a bracket indicating the appropriate bars. *=P≤0.01; **=P<0.03

