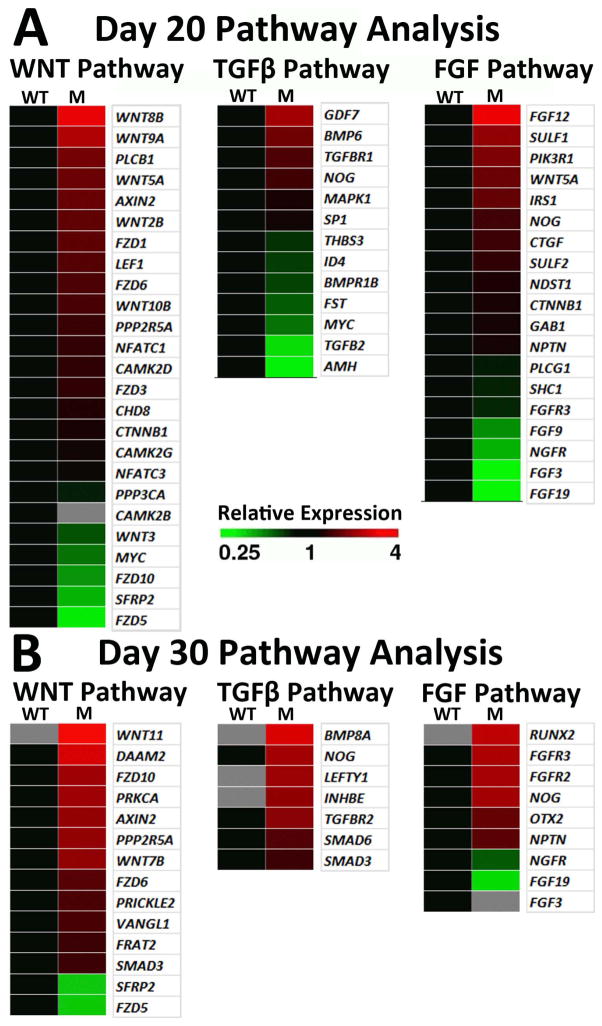
Figure 7. Comparative RNAseq signaling pathway analysis suggests potential mechanisms for the RPE cell fate bias in (R200Q)VSX hiPSC-OVs.
WNT, TGFβ, and FGF pathway analyses were performed at day 20 (A) and day 30 (B) of differentiation. Grey squares denote genes that were not expressed. Up- (red) and down- (green) regulation of mutant hiPSC-OV gene expression is shown relative to WT hiPSCs at the same time point. Pathway analyses were performed with GeneSifter software, using KEGG search terms for WNT and TGFβ, while FGF pathway analysis was performed with Gene Ontology (GO) search terms.

