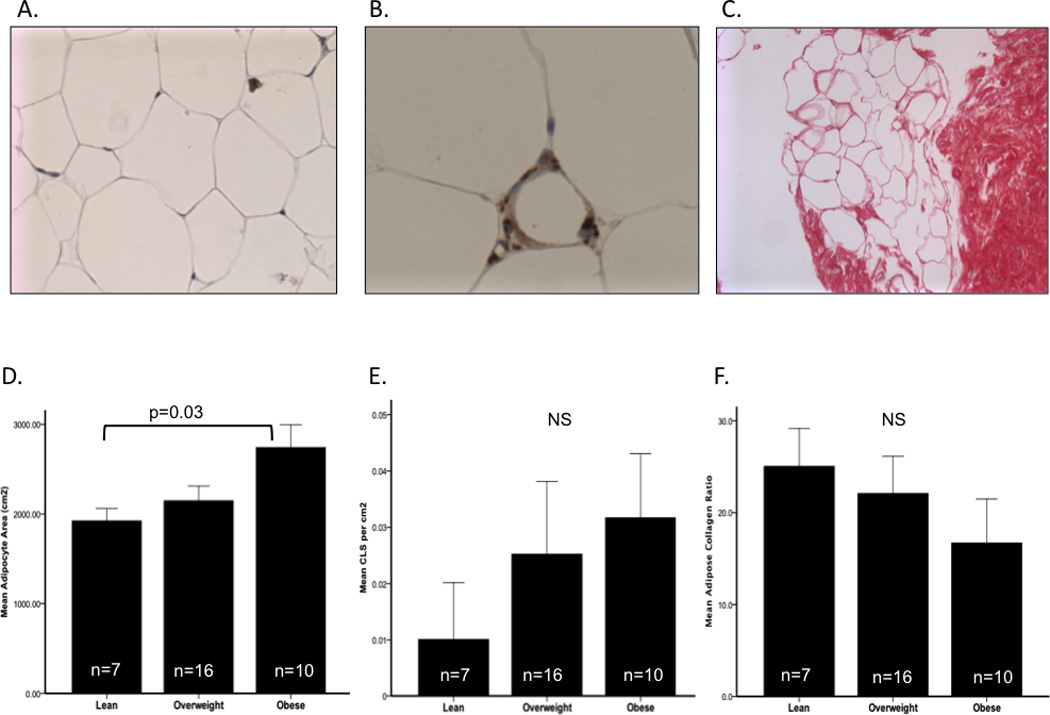
Figure 1.

Adipose cell size, CLS presence and collagen ratio as a function of obesity.
Histological analysis of SAT adipose sections (Panel A) at 20x magnification demonstrated a significant increase in adipocyte cell area (µ2) between lean and obese participants (Panel D). CD68 immunihistochemical staining for macrophages identified CLS in 14 of 33 participants (Panel B) and a clinical increase in CLS per cm2 by obesity was observed (Panel E). Picrosirius red staining was used to assess fibrosis in SAT through obtaining a collagen ratio (Panel C). A trend in decreasing collagen ratio as a function of obesity was observed (Panel F). CLS=crown-like structures, SAT= subcutaneous adipose tissue.
