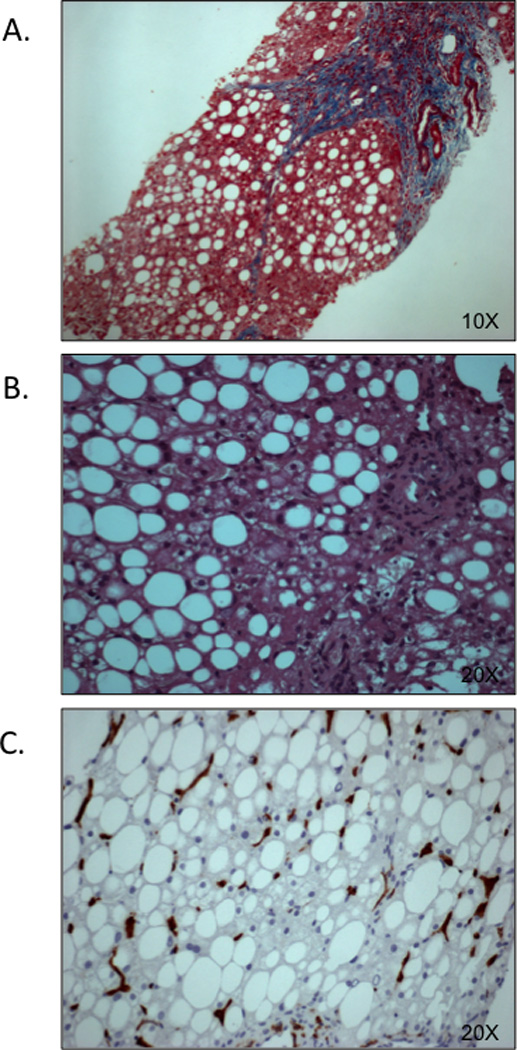
Figure 2.

Liver histology: Steatosis, fibrosis and inflammation
Panel A (10× magnification), is a representative image of NASH with steatosis, and fibrosis score F3. Panel B represents a child with NASH (steatosis grade 2, ballooning grade 1, and inflammation grade 1. Panel C depicts steatosis score 2 and hepatic inflammation as evidenced by CD163+ Kupfer cell staining. Images adapted from Alkhouri et al. (18).
