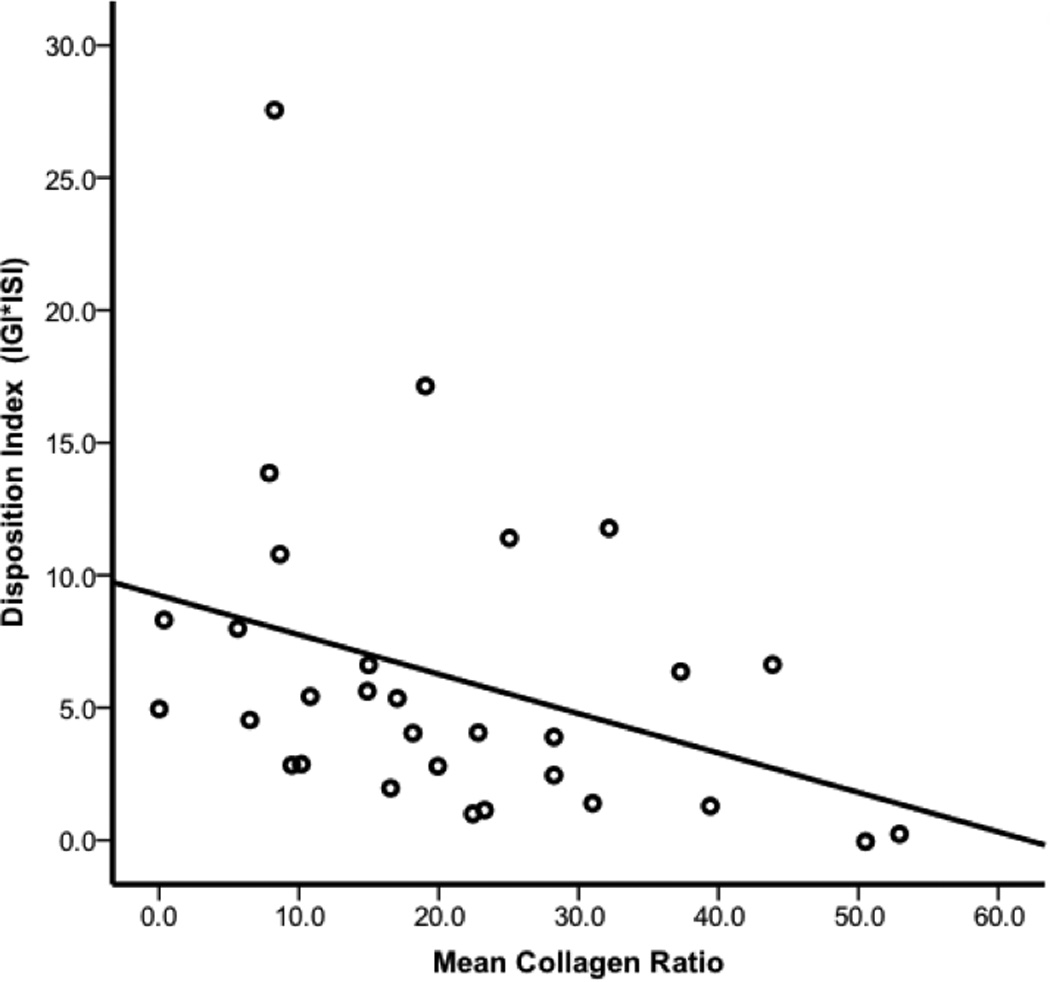
Figure 3.

Mean adipose collagen ratio is inversely associated with disposition index Mean adipose collagen ratio is displayed on the x-axis and mean disposition index is on the y-axis. Disposition index decreased as a function of increasing adipose fibrosis. Graphical data are presented as raw, unadjusted values and the correlation (−0.31, p=0.05) persisted after controlling for age, gender and BMI.
