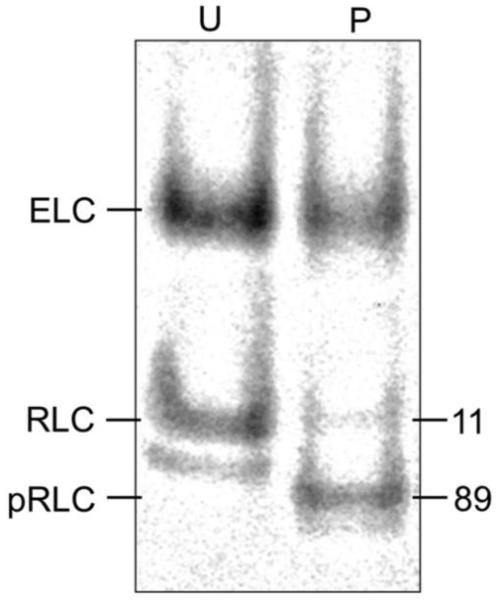
Figure 1.
Urea PAGE of unphosphorylated (U) and phosphorylated (P) βMys. Protein bands were stained with SYPRO Ruby and the fluorescence quantitated with ImageJ. The faint band below the main RLC band is an unphosphorylated RLC with altered charge due to methylation or other post translational modification (1). Numbers indicate % of total RLC content.

