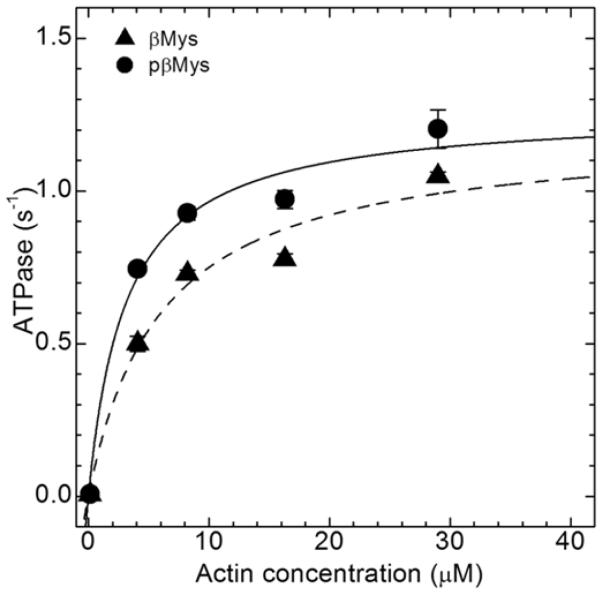
Figure 2.
Actin-activated ATPase of unphosphorylated (triangle) and phosphorylated (circle) βMys. Michaelis-Menten fitting constants Vmax = 1.20 ± 0.13 and 1.26 ± 0.09 s−1, Km = 6 ± 2 and 3 ± 1 μM for unphosphorylated and phosphorylated samples are derived using ATPase=Vmax•[Actin]/(Km+[Actin]). Error bars show standard deviation.

