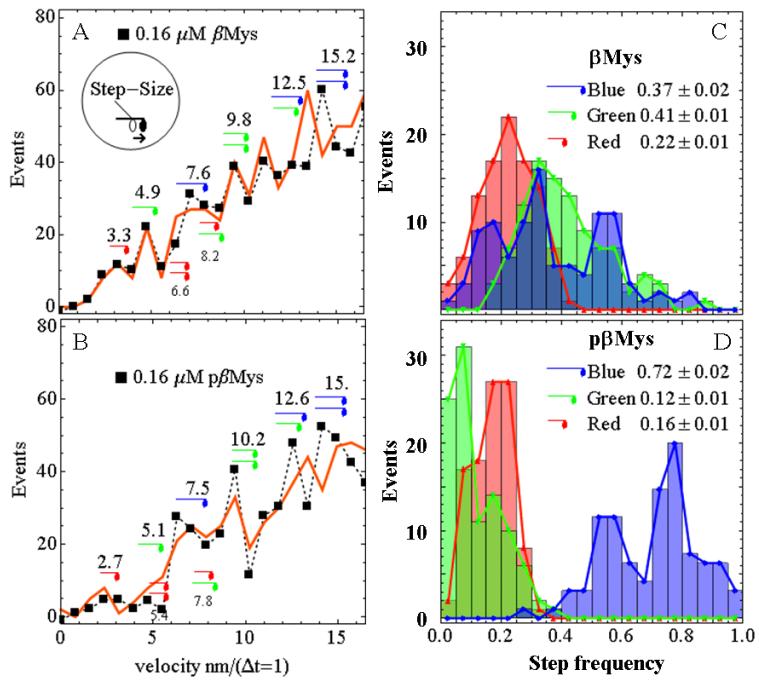
Figure 4.
Measured (squares and dashed line) and simulated (red line) velocity event distributions for unphosphorylated (Panel A) and phosphorylated (Panel B) βMys (βMys and pβMys) and 200 ms frame capture interval. The Panel A insert indicates translation of the motor domain associated with unitary step-size and lever-arm rotation. Unitary steps of ~3 nm (red), ~5 nm (green), and ~8 nm (blue) are indicated symbolically near their event distribution peak. Several unitary step combinations are also indicated. Panels C & D show the histograms for step frequency. βMys panels (0% phosphorylation) corresponded to 894 total unitary events and pβMys panels (81-89% phosphorylated) to 710 total unitary events. The simulated velocity curve corresponds to the best fitting single simulation while the histograms summarize findings from the best 100 simulations. Errors are SEM for 100 simulations.

