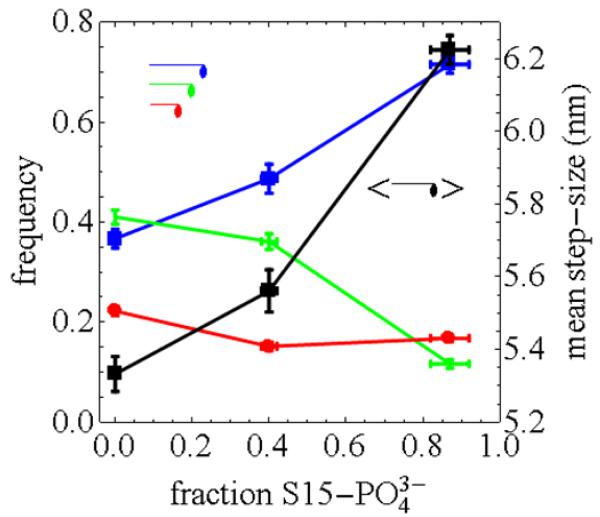
Figure 5.
Relative frequency (left abscissa) and mean step-size (right abscissa) associated with the unitary steps vs the fraction of RLC S15 phosphorylation. The blue (8 nm), green (5 nm), and red (3 nm) curves indicate that the frequency gain as the fraction of S15’s phosphorylated increases. The black curve shows the approximately linear increase in the mean step size vs the fraction of S15’s phosphorylated. Vertical error bars in blue, green, and red curves are frequency SEM for 100 simulations. Vertical error bars for the black curve are mean step-size SEM combining step-size and step frequency errors. Horizontal error bars on all curves are estimates based on the declining phosphorylated fraction over the course of the experiments as indicated in Figure 1.

