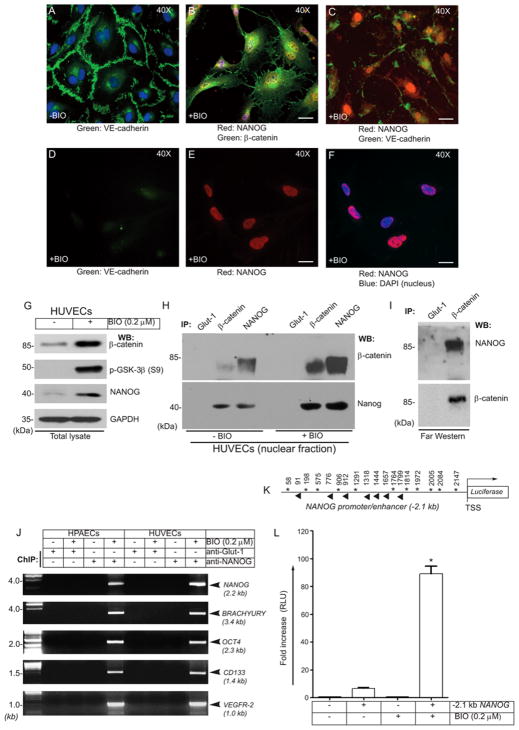
Figure 1. BIO mediates interaction of β-catenin with NANOG, and NANOG binds to the NANOG and BRACHYURY promoters.
Sparsely plated HUVECs treated without or with BIO were subjected to staining and microscopy. (A) Anti-VE-cadherin (green), (B) Anti-human β-catenin (green) and anti-human NANOG (red); (C) Anti-human VE-cadherin (green) and anti-human NANOG (red) staining. (D) Reduced VE-cadherin (green) staining in ECs treated with BIO. (E) Nuclear accumulation of NANOG (red). (F) NANOG, red; DAPI, blue (merge). Scale bar is 100 μm. (G) EC extracts were analyzed by immunoblotting with the indicated antibodies. Note: increased β-catenin and NANOG in nuclear extracts. GAPDH represents equal loading. (H) Reciprocal co-IP of NANOG with β-catenin. (I) Far-Western showing the interaction is direct: EC extracts were immunoprecipitated with indicated antibodies, membrane incubated (ligand blotting) with human recombinant NANOG protein (2.0 μg/ml), then analyzed by immunoblotting with anti-human NANOG antibody (top). This blot was stripped then reprobed with anti-β-catenin antibody (bottom). Results are representative of 3 independent experiments. (J) Chromatins IP prepared from HPAECs and HUVECs were analyzed for the presence of indicated promoters. Compared with control cells, anti-NANOG showed enrichment of NANOG, OCT4, BRACHYURY, CD133, and VEGFR-2 promoters after BIO stimulation. In contrast, there was no amplification in anti-Glut-1 ChIP (negative control). (K) Schematic of the NANOG-promoter/enhancer region showing putative NANOG (asterisks, direct strand; diamond, reverse strand) binding consensus sites. The position is relative to the TSS. (L) ECs transiently transfected with pGL4.84 (control) or with pGL4.84-(−2.1-NANOG) promoter were treated with BIO (0.2 μM) for 6 hrs. NANOG-promoter Renilla luciferase activity after BIO treatment is presented as the fold induction of RLU (relative luciferase unit) versus control. Results represent the mean of 3 independent experiments ± S.E.M. *, P < 0.05.

