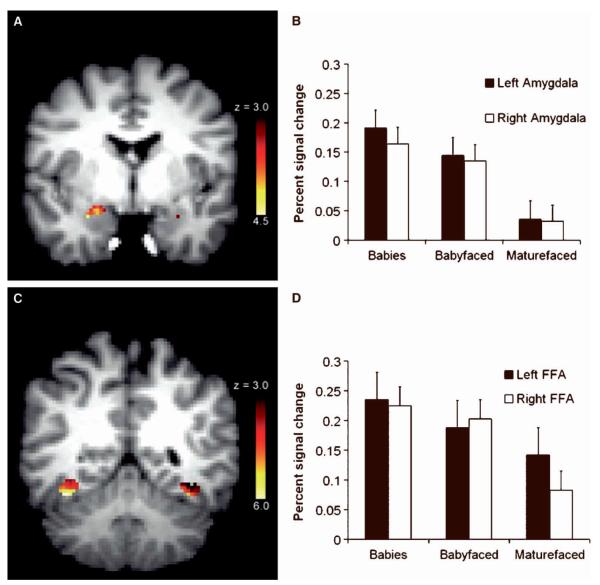
Figure 1.
Neural activity in the amygdala and FFA regions of interest. (A) Activation in the amygdala ROI to all faces versus baseline fixation (cluster based threshold: z > 3.0) determined by a mixed-effects group analysis. The most significant activation in the right side was in the Talairach coordinate (28, −4, −20) with z = 4.29. The most significant activation in the left side was in the coordinate (−28, −4, −20) with z = 3.34. (B) Means and standard errors of percent change in the left and right amygdala BOLD signal for each face category compared with baseline. (C) Activation in the FFA ROI to all faces versus baseline fixation (cluster based threshold: z > 3.0) determined by a mixed-effects group analysis. The most significant activation in the right side was in the Talairach coordinate (38, 53, 14) with z 5.97. The most significant activation in the left side was in the Talairach coordinate ( −36, −78, −11) with z =6.17. (D) Means and standard errors of percent change in the left and right FFA BOLD signal for each face category compared with baseline.

