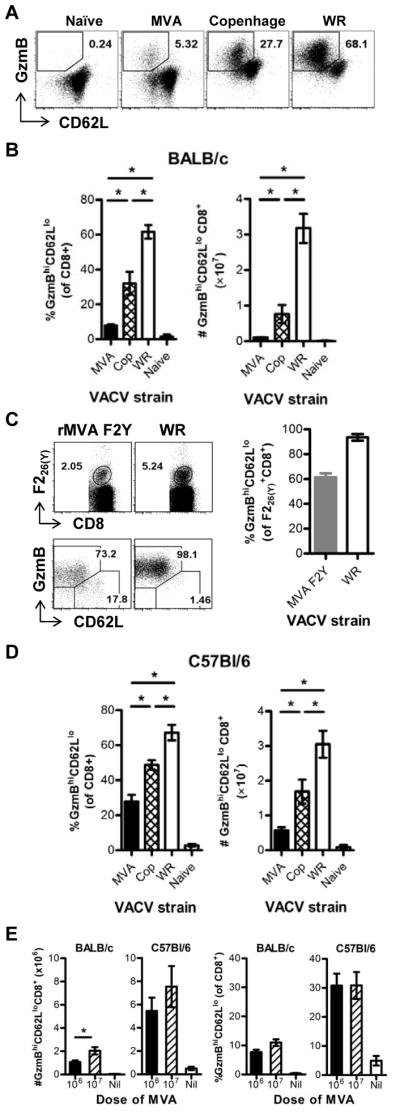
Figure 2. Total TCD8+ cell response to VACV strains in BALB/c and C57Bl/6 mice.

Groups mice were immunized i.p. with 1×10⁶ or 1×10⁷ PFU of VACV strains as shown or were control (naïve) injected with 200 μl PBS, i.p.. After 7 days splenocytes were analyzed for surface CD62L and intracellular GzmB (A, B, D and E) or F226(Y)-loaded DimerX-binding, CD62L and GzmB (C). (A) Representative flow cytometry plots (gated on CD8+ events) for each VACV strain and naïve control in BALB/c mice. (B) Averages (and SEM) of CD62Llo GzmBhi events in BALB/c mice analyzed as a % of CD8+ events (left) and total numbers of CD8+, CD62Llo GzmBhi events (right). Data are from 2 for uninfected mice, 6 Copenhagen-, 6 MVA- and 12 WR-infected mice across two experiments. (C) Representative flow cytometry plots gated on CD8+ (top row), and on F226(Y)-DimerX+, as shown on top plots (bottom row) of splenocytes from mice immunized with MVA F2Y or WR in BALB/c mice. Graph on right shows average percent (and SEM) of CD62LloGzmBhi amongst F226(Y)-specific TCD8+. (D) Same as B, but using C57Bl/6 mice. (E) Comparison of two doses of MVA (1×10⁶ and 1×10⁷ PFU in BALB/c and C57Bl/6 mice as shown on graphs. Total numbers of activated TCD8+ per spleen are on the left and the percent of activated cells amongst CD8+ events on the right. (D and E) Data are from 2 uninfected mice and 6 mice infected with each VACV strains across two experiments. (*p < 0.05, Mann Whitney test).
