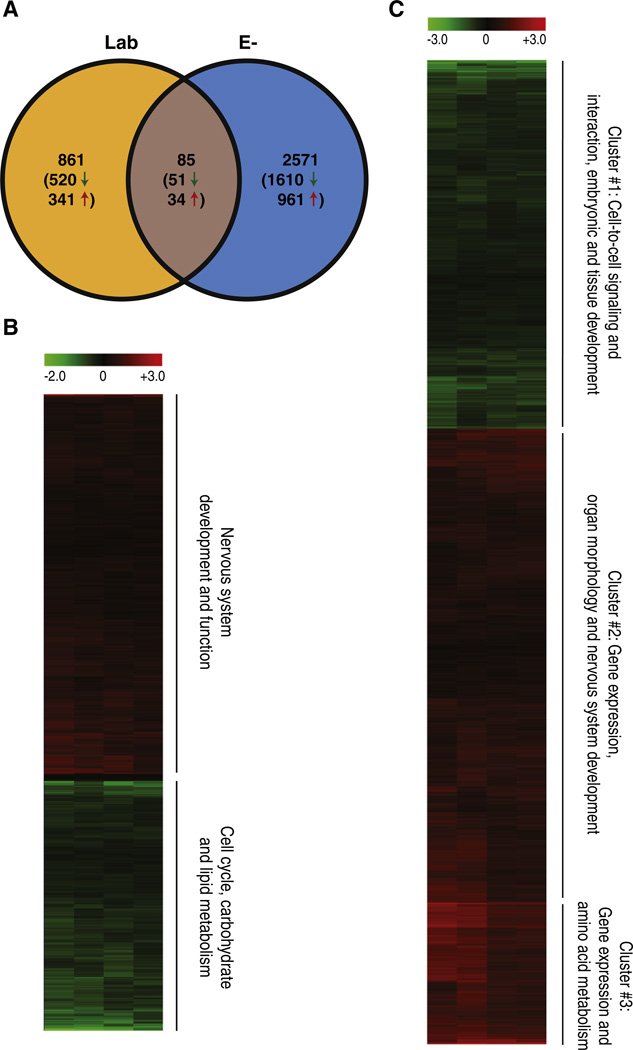
Fig. 3.
Global effects of parental diet on embryonic transcription. A. A Venn diagram displaying differentially represented transcripts. Both Lab and E− groups were first compared to the E+ defined diet control group; significant transcripts (p < 0.01) from each set were then compared as represented in the figure. B and C. Transcripts from Lab (B) and E−(C) that were significantly different from the E+ controls were grouped using bi-hierarchical clustering as displayed in the heat map. General annotations for each cluster are noted on the right side of the heat maps (annotation generated using IPA and DAVID).

