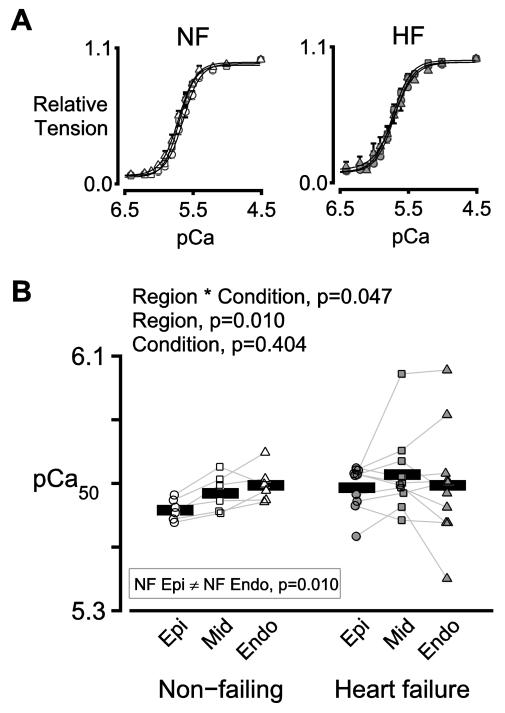
Figure 3. Transmural variation in Ca2+ sensitivity is disrupted in heart failure.
A) Mean values of normalized isometric tension plotted against pCa (= −log10[Ca2+]) for preparations from the three transmural regions of non-failing (left) and failing (right) hearts. Circles, squares, and triangles show data for sub-epicardial, mid-myocardial, and sub-endocardial preparations respectively. B) Symbols show the mean of the pCa50 values measured using 2 or 3 preparations from each region for each heart.

