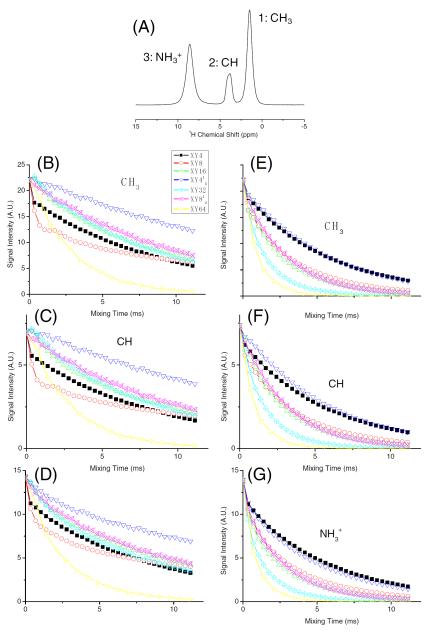
Figure 2. Loss of magnetization under RFDR.
(A) Proton MAS NMR spectrum of U-13C,15N-L-alanine powder sample obtained at 92 kHz MAS. (B-G) Peak intensities measured from 1D 1H NMR using the pulse sequence given in Figure 1A (for t1=0) as a function of fp-RFDR mixing time. Measurements were carried out using two different RF field strengths for the 180° pulse in the fp-RFDR sequence: 467 kHz (B, C and D) and 110 kHz (E, F and G).

