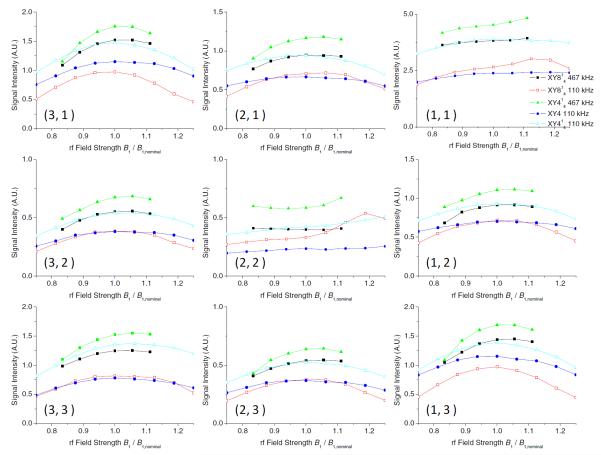
Figure 5. RF field inhomogeneity dependence of fp-RFDR.
Variation of peak (both diagonal and cross) intensities on the fp-RFDR RF field inhomogeneity obtained using XY4, XY414, and XY814 phase cycles at RF field strengths of 467 kHz and 110 kHz with mixing times of 2.78 ms and 1.39 ms, respectively. Peaks are labeled as described in Figure 3 caption.

