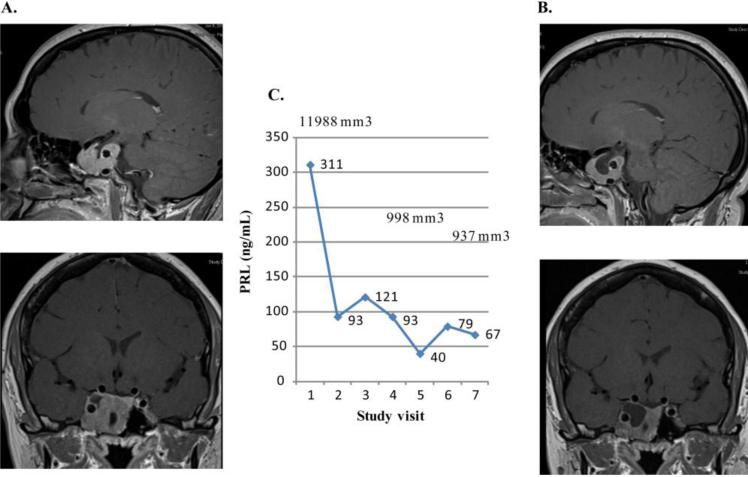
Figure 3.
Prolactin levels and tumor volumes in first lapatinib treated subject. The MRI of subject 1 is depicted. A. Baseline MRI demonstrates homogeneously enhancing mass in right aspect of sella extending into cavernous sinus and encasing the carotid vessel, and abutting inferior aspect of right prechiasmatic optic nerve. Lesion measures 23 × 27 × 34 mm. B. MRI after 6 months on lapatinib shows regression of central portion of the tumor mass. C. Graph shows PRL levels (ng/mL) and tumor volumes (mm 3) at baseline (study visit 1) and at monthly intervals.

