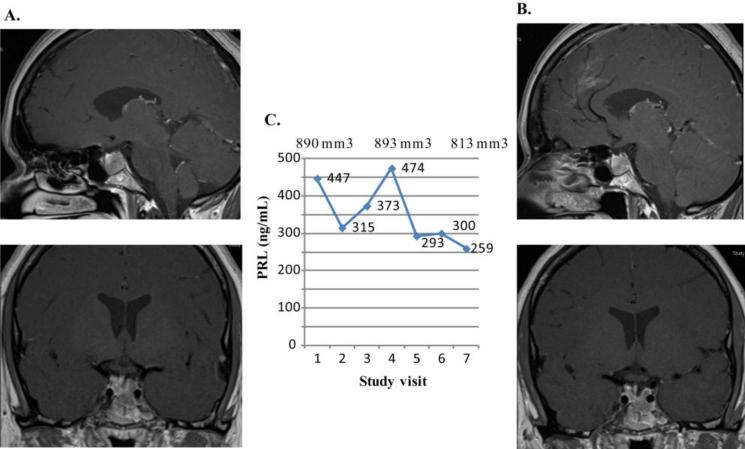
Figure 4.
Prolactin levels and tumor volumes in second lapatinib treated subject. The MRI of subject 2 is depicted. A. Baseline MRI demonstrates a hypoenhancing intrasellar mass inferolateral on the left side growing into the left cavernous sinus. The mass measures 9.9 mm transversely, 6.8 mm cephalocaudad, and 13.1 mm anteroposteriorly. B. MRI after 6 months on lapatinib shows no change. C. Graph shows PRL levels (ng/mL) and tumor volumes (mm3) at baseline (study visit 1) and at monthly intervals.

