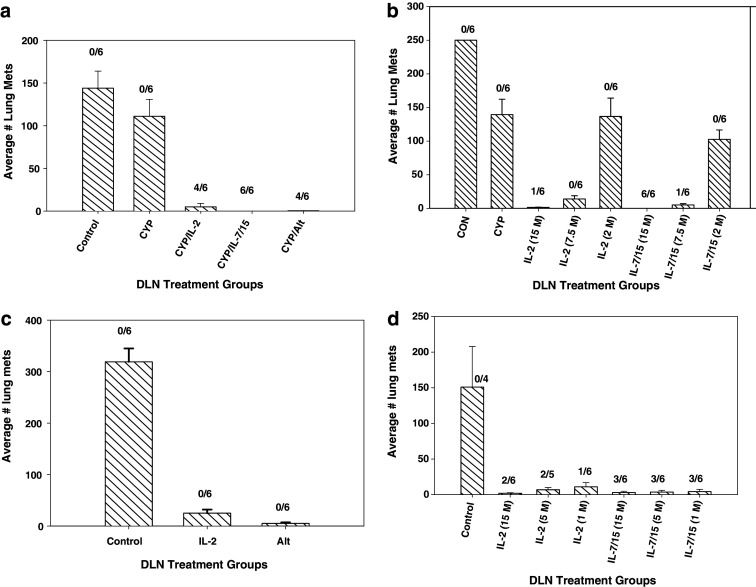
Fig. 6.
Adoptive immunotherapy of B16 melanoma lung metastases with T cells activated with B/I and cultured in IL-2, IL-7/15 or alternating cytokines. a Recipient C57BL/6 mice were injected intravenously with 250,000 B16F10 melanoma cells and randomized to five treatment groups: untreated control (CON), cyclophosphamide (CYP) treated (100 mg/kg), and CYP + AIT with B/I-activated DLN cells from B16-GMCSF sensitized pmel-1 mice cultured in IL-2 or IL-7/15 or alternating cytokines at 15 × 106 cells/mouse. CYP was given 3 days after tumor inoculation and cultured lymphocytes were infused i.v. the following day. After 24 days, lungs were harvested and lung metastases were counted. The data shown are the mean number of lung metastasis ± SE of six mice per group. All treated groups were significantly different from CON and from CYP only group (Wilcoxon/Kruskal Wallis rank sum test, for all groups: χ 2 = 24.2, df = 4, P < 0.0001; CON vs CYP: P = 0.1705; CYP vs IL2: P = 0.0033; CYP vs IL7/15: P = 0.0021; CYP vs ALT: P = 0.0033; IL2 vs IL7/15: P = 0.1396; IL2 vs ALT: P = 0.8474; IL7/15 vs ALT: P = 0.1380. Numbers above each histogram are the number of mice with no detectable lung nodules out of six mice in each group. b Recipient C57BL/6 mice were injected intravenously with 250,000 B16F10 melanoma cells and randomized to eight treatment groups: untreated control (CON), cyclophosphamide (CYP) treated (100 mg/kg), and CYP + AIT with B/I-activated DLN cells from B16-sensitized pmel-1 mice cultured in IL-2 or IL-7/15 at doses of 15, 7.5, or 2 × 10⁶ cells/mouse [cytokines used for expansion and cell doses (in parentheses) shown along the x-axis]. CYP was given 3 days after tumor inoculation and cultured lymphocytes were infused i.v. the following day. After 24 days, lungs were harvested and lung metastases were counted. The data shown are the mean number of lung metastasis ± SE of six mice per group. All treated groups were significantly different from CON; groups treated with AIT at T cell doses of 7.5 × 10⁶ and 15 × 106 were significantly different from CYP only group and IL-7/15 group at 15 × 106 was significantly different from IL-2 group at same cell dose (Wilcoxon/Kruskal Wallis test—comparing all groups: χ 2 = 43.0, df = 7, P < 0.0001; CON vs. CYP: P = 0.0021; CYP vs IL-2 at 7.5 million cells: P = 0.0039; CYP vs IL-7/15 at 7.5 million cells: P = 0.0039; CYP vs IL-2 at 15 million cells: P = 0.0037; CYP vs IL-7/15 at 15 million cells: P = 0.0021; IL-2 vs IL-7/15 at 15 million: P = 0.0069; Other comparisons not significantly different). Numbers above each histogram are the number of mice with no detectable lung nodules out of six mice in each group. c Naïve C57BL/6 mice randomized to three treatment groups: untreated controls or infusion of B/I-activated DLN cells from B16-sensitized pmel-1 mice cultured in IL-2 or alternating cytokines 25 × 106 cells/mouse. Three weeks later, mice were injected intravenously with 250,000 B16F10 melanoma cells and after 24 days, lungs were harvested and lung metastases were counted. The data shown are the mean number of lung metastasis ± SE of six mice per group. Wilcoxon–Kruskal Wallis test—comparing all groups: χ 2 = 13.4, df = 2, P = 0.0012; CON vs ALT: P = 0.0039; CON vs IL-2: P = 0.0062; ALT vs IL-2: P = 0.0174. Similar results were obtained in a separate experiment using cells grown in IL-2, IL-7/15 or alternating cytokines. Numbers above each histogram are the number of mice with no detectable lung nodules out of six mice in each group. d Naïve C57BL/6 mice randomized to seven treatment groups: untreated controls or infusion of B/I-activated DLN cells from B16-sensitized pmel-1 mice cultured in IL-2 or IL-7 + IL-15, each at 15, 5, or 1 million cells/mouse [cytokines used for expansion and cell doses (in parentheses) shown along the x-axis]. Three weeks later, mice were injected intravenously with 250,000 B16F10 melanoma cells and after 24 days, lungs were harvested and lung metastases were counted. The data shown are the mean number of lung metastasis ± SE of six mice per group. Wilcoxon–Kruskal Wallis test—comparing all groups: χ 2 = 12.95, P = 0.044; CON vs each IL-2 group: P < 0.01; CON vs each IL-7/15 group, P < 0.01; all other comparisons NS. Numbers above each histogram are the number of mice with no detectable lung nodules out of six mice in each group

